---
title: "Solution — Day 1 microbiome (classical)"
format:
html:
toc: true
toc_depth: 3
code-tools: true
---
Tasks **1.1–1.8** on the [lab exercises page](../index.qmd). Classical R only (no `tidymodels`). Uses the Schloss mouse 16S tables from public GitHub URLs and compares **PCA + logistic regression**, **stepAIC**, and **lasso** on **`Label`** (Early vs Late) and **`Sex`**.
```{r setup, include=FALSE}
knitr::opts_chunk$set(
echo = TRUE,
message = FALSE,
warning = FALSE,
fig.align = "center",
dpi = 120
)
suppressPackageStartupMessages({
library(ggplot2)
library(tidyverse)
library(MASS)
library(glmnet)
library(broom)
library(patchwork)
})
theme_set(
theme_minimal(base_size = 13) +
theme(
plot.title = element_text(face = "bold"),
legend.position = "bottom"
)
)
load_microbiome <- function(prev = 0.10) {
microbiome_base <- "https://raw.githubusercontent.com/quadram-institute-bioscience/datasciencegroup/main/4_machine_learning/mouse-16s"
if (!requireNamespace("readr", quietly = TRUE)) stop("Install readr")
if (!requireNamespace("dplyr", quietly = TRUE)) stop("Install dplyr")
meta <- readr::read_csv(file.path(microbiome_base, "metadata.csv"), show_col_types = FALSE) |>
dplyr::rename(sample_id = `#NAME`)
otu_raw <- readr::read_csv(file.path(microbiome_base, "otutab_raw.csv"), show_col_types = FALSE)
otu_mat <- t(as.matrix(otu_raw[, -1]))
colnames(otu_mat) <- otu_raw$`#NAME`
meta <- dplyr::filter(meta, sample_id %in% rownames(otu_mat))
otu_mat <- otu_mat[meta$sample_id, , drop = FALSE]
prev_keep <- colMeans(otu_mat > 0) >= prev
otu_mat <- otu_mat[, prev_keep, drop = FALSE]
dplyr::bind_cols(
sample_id = meta$sample_id,
Individual = meta$Individual,
Label = factor(meta$Label, levels = c("Early", "Late")),
Sex = meta$Sex,
Day = meta$Day,
as.data.frame(otu_mat)
)
}
mic_otu_cols <- function(mic) {
setdiff(names(mic), c("sample_id", "Individual", "Label", "Sex", "Day"))
}
load_otu_taxonomy <- function() {
microbiome_base <- "https://raw.githubusercontent.com/quadram-institute-bioscience/datasciencegroup/main/4_machine_learning/mouse-16s"
readr::read_csv(file.path(microbiome_base, "taxonomy.csv"), show_col_types = FALSE) |>
dplyr::rename(otu = `#TAXONOMY`) |>
dplyr::mutate(
display = dplyr::case_when(
!is.na(Genus) & Genus != "" ~ paste0(Genus, " (", otu, ")"),
!is.na(Family) & Family != "" ~ paste0(Family, " (", otu, ")"),
TRUE ~ otu
)
)
}
annotate_otu <- function(df, tax, otu_col = "otu") {
df |>
dplyr::left_join(
dplyr::select(tax, otu, display, Genus, Family, Phylum),
by = stats::setNames("otu", otu_col)
)
}
in_sample_metrics <- function(truth, prob, positive = "Late", threshold = 0.5) {
truth <- factor(truth)
neg <- setdiff(levels(truth), positive)[1]
pred <- factor(ifelse(prob > threshold, positive, neg), levels = levels(truth))
tab <- table(Predicted = pred, Observed = truth)
acc <- mean(pred == truth)
# sensitivity = P(pred pos | true pos); specificity = P(pred neg | true neg)
pos <- positive
neg_lvl <- neg
sens <- tab[pos, pos] / sum(tab[, pos])
spec <- tab[neg_lvl, neg_lvl] / sum(tab[, neg_lvl])
list(
accuracy = acc,
sensitivity = sens,
specificity = spec,
confusion = tab,
predicted = pred
)
}
fit_label_models <- function(dat_label, log_otu, y_factor, n_pc = 5) {
y_factor <- factor(y_factor)
m_glm <- glm(Label ~ ., data = dat_label, family = binomial)
m_null <- glm(Label ~ 1, data = dat_label, family = binomial)
m_fwd <- stepAIC(
m_null,
scope = list(lower = m_null, upper = m_glm),
direction = "forward",
trace = 0
)
m_bwd <- stepAIC(m_glm, direction = "backward", trace = 0)
x_lasso <- scale(log_otu)
y_lasso <- ifelse(y_factor == levels(y_factor)[2], 1, 0)
set.seed(7)
cv_fit <- cv.glmnet(x_lasso, y_lasso, family = "binomial", alpha = 1, nfolds = 5)
list(
glm = m_glm,
forward = m_fwd,
backward = m_bwd,
lasso = cv_fit,
x_lasso = x_lasso
)
}
model_row <- function(outcome, method, n_pred, metrics, aic = NA_real_) {
tibble(
outcome = outcome,
method = method,
n_predictors = n_pred,
train_accuracy = metrics$accuracy,
sensitivity = metrics$sensitivity,
specificity = metrics$specificity,
AIC = aic
)
}
```
# Part 1 — Load and explore
## 1.1 Load and filter
We merge metadata and OTU counts, transpose to **samples × OTUs**, and drop OTUs present in fewer than 10% of samples. This prevalence filter removes extremely rare taxa that add noise and widen the design matrix without stable signal.
```{r load}
mic <- load_microbiome(prev = 0.10)
otu_cols <- mic_otu_cols(mic)

cat("Dimensions (rows = samples, cols = metadata + OTUs):\n")
print(dim(mic))
cat("\nLabel counts:\n")
print(table(mic$Label))
cat("\nSex counts:\n")
print(table(mic$Sex, useNA = "ifany"))
cat("\nUnique mice (Individual):\n")
print(length(unique(mic$Individual)))
```
## OTU taxonomy — readable names
OTU columns in the count table are anonymous IDs (`seq_5`, `seq_14`, …). A fourth public file, **`taxonomy.csv`**, maps each ID to standard ranks (Kingdom → Species). Not every OTU resolves to genus or species — many stop at family (e.g. `Bacteroidales_S24-7_group`).
```{r taxonomy}
tax <- load_otu_taxonomy()

tax |>
  dplyr::filter(otu %in% otu_cols) |>
  dplyr::mutate(
    has_genus = !is.na(Genus) & Genus != "",
    has_family_only = !has_genus & !is.na(Family) & Family != ""
  ) |>
  dplyr::count(has_genus, has_family_only, name = "n_otus") |>
  knitr::kable(caption = "Taxonomic resolution after prevalence filter")
tax |>
  dplyr::filter(otu %in% otu_cols, !is.na(Genus), Genus != "") |>
  dplyr::select(otu, Phylum, Family, Genus) |>
  dplyr::slice_head(n = 12) |>
  knitr::kable(caption = "Example OTUs with genus-level names")
```
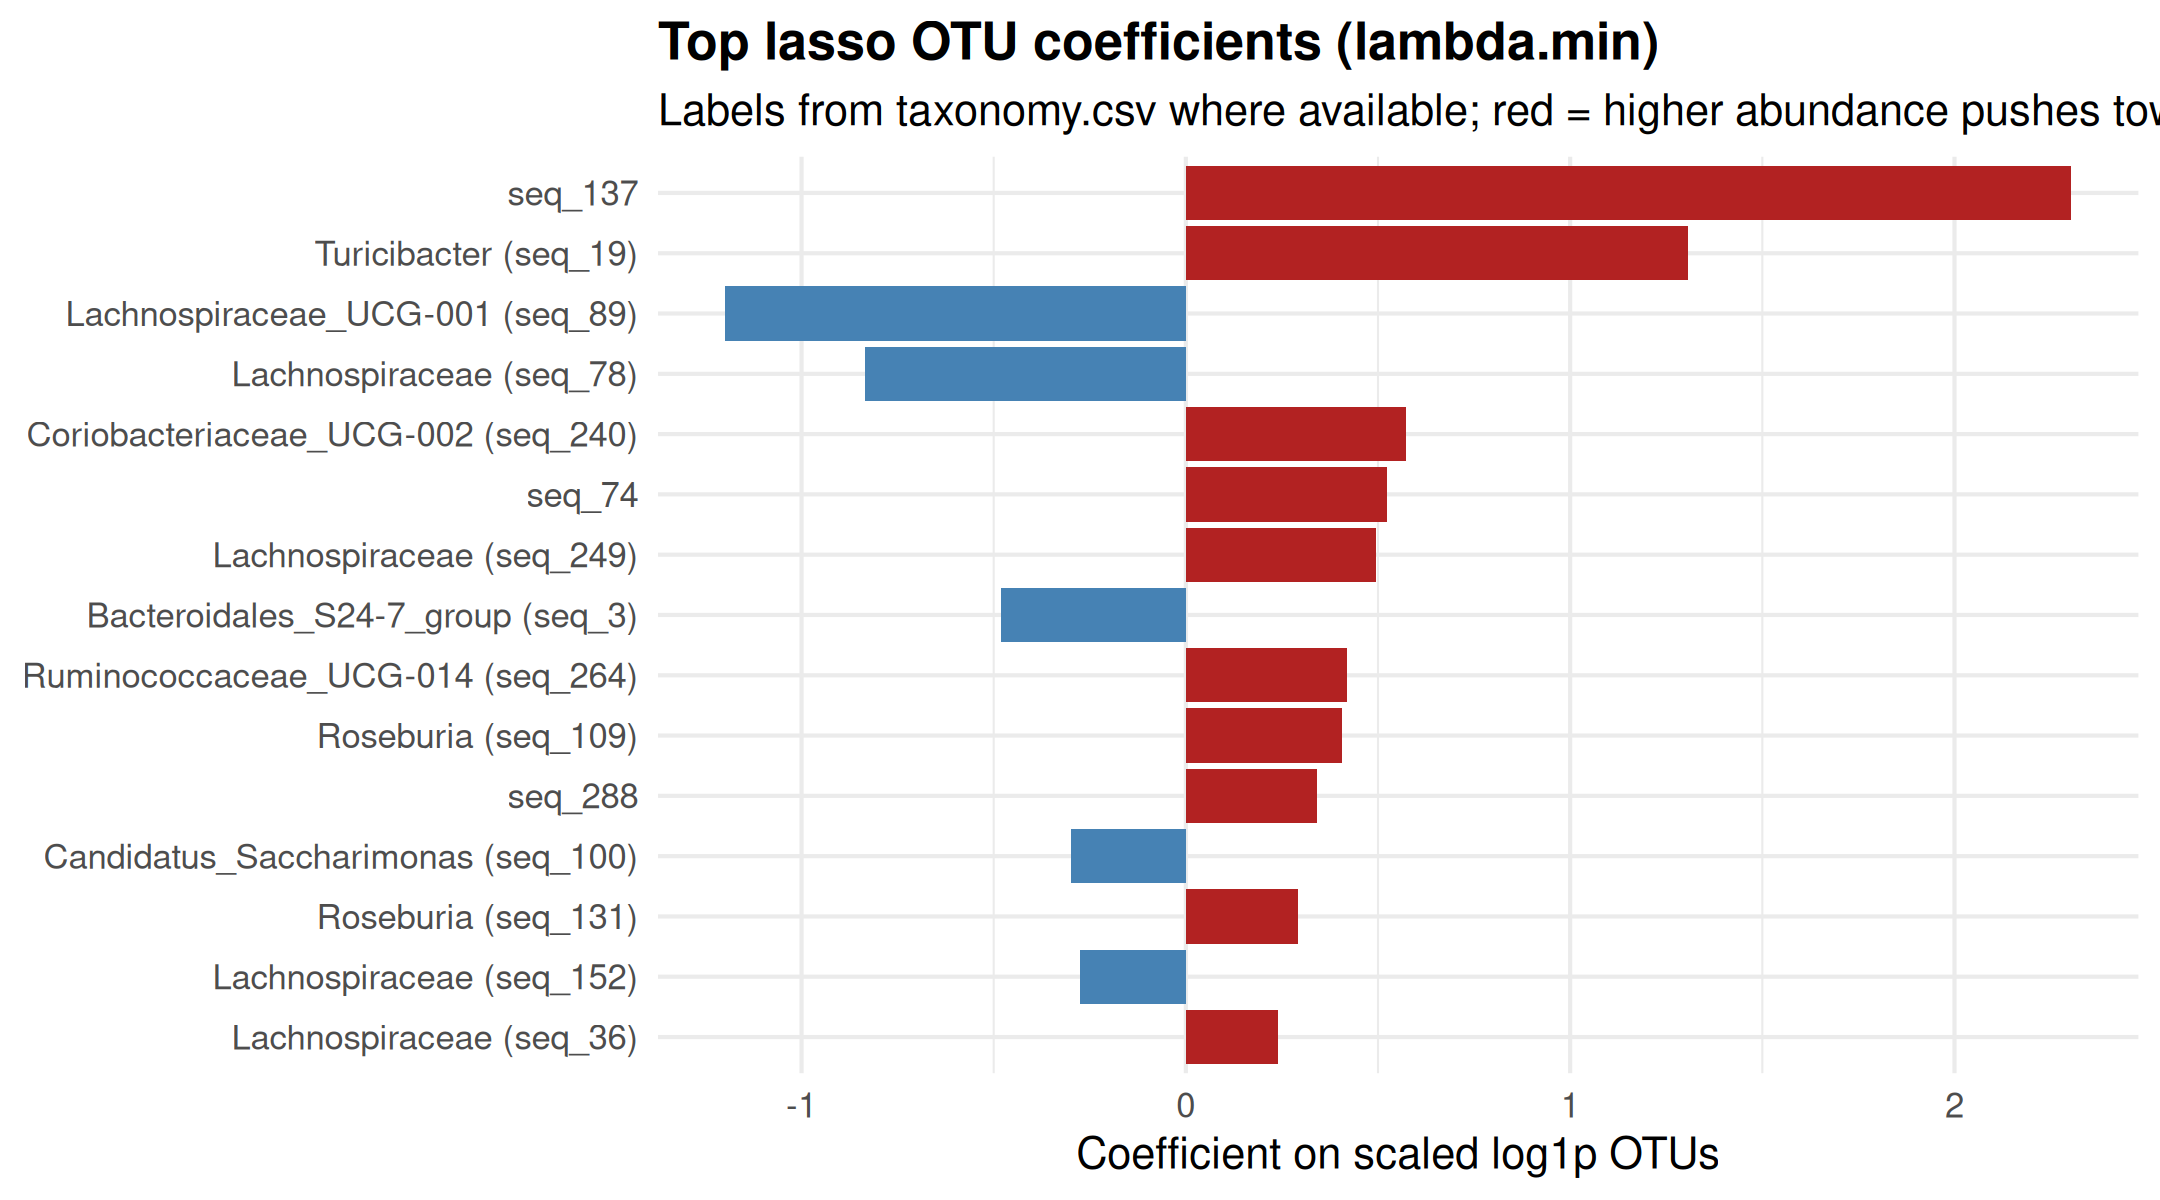
We use `display` labels in the lasso plot below: **Genus (seq_id)** when available, otherwise **Family (seq_id)**, otherwise the raw OTU ID.
```{r explore-meta, fig.width=9, fig.height=4}
p_label <- ggplot(mic, aes(Label, fill = Label)) +
  geom_bar(show.legend = FALSE) +
  labs(title = "Samples per Label", x = NULL, y = "Count") +
  scale_fill_brewer(palette = "Set2")

p_day <- ggplot(mic, aes(Day, fill = Label)) +
  geom_histogram(bins = 30, alpha = 0.75, position = "identity") +
  labs(title = "Sampling day by community stage", x = "Day", y = "Count") +
  scale_fill_brewer(palette = "Set2")

p_mice <- mic |>
  count(Individual, Label) |>
  ggplot(aes(Individual, n, fill = Label)) +
  geom_col() +
  labs(title = "Longitudinal samples per mouse", x = "Mouse ID", y = "Number of samples") +
  theme(axis.text.x = element_blank()) +
  scale_fill_brewer(palette = "Set2")

p_label + p_day + plot_layout(ncol = 2, widths = c(1, 1.4))
```
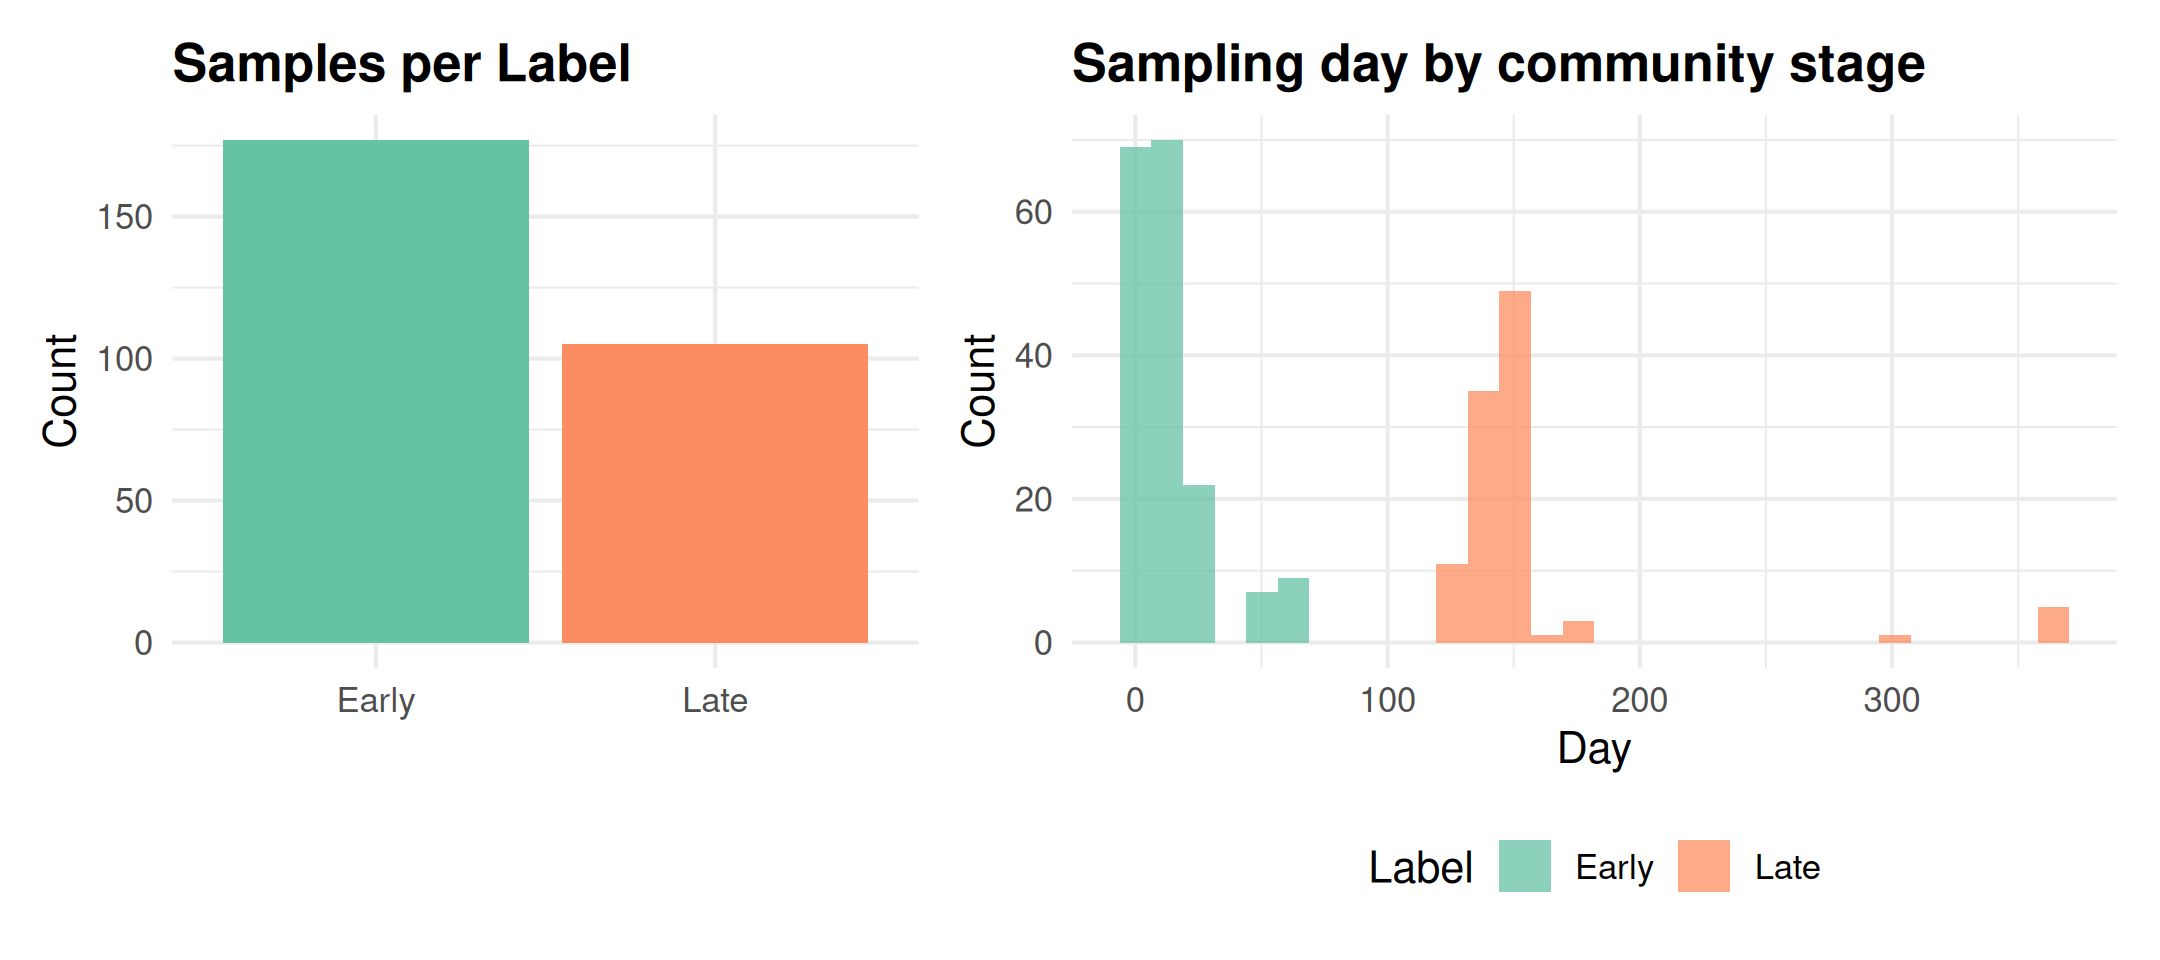
**Takeaway:** `Early` and `Late` are not perfectly balanced, and the same `Individual` contributes multiple rows. That repeated-measures structure matters later when we discuss validation (Day 2 random split vs Day 4 grouped CV).
## 1.2 log1p transform
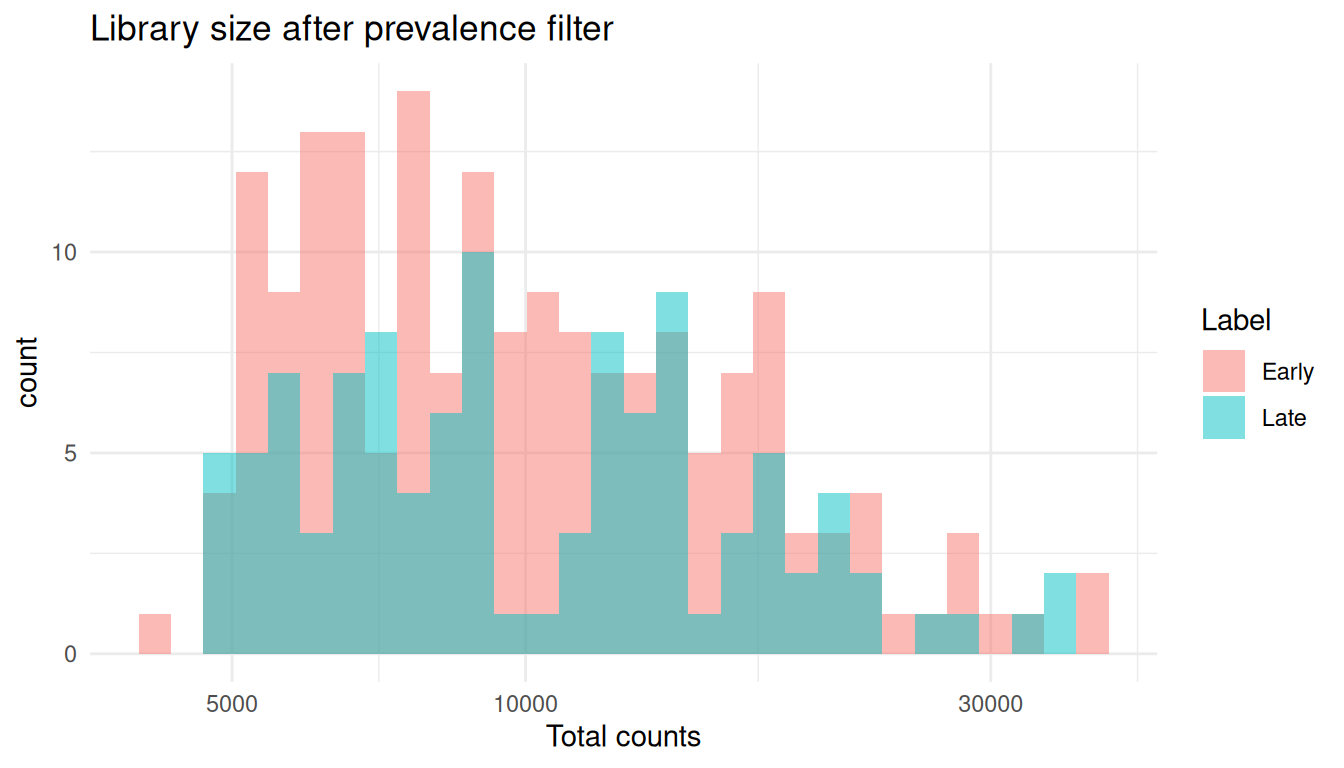
Raw counts are **right-skewed** and dominated by a few abundant OTUs. **`log1p(x) = log(1 + x)`** compresses large values while keeping zeros at zero. We also record **library size** (total counts per sample) to check whether sequencing depth differs by group.
```{r log1p}
otu_mat <- as.matrix(mic[, otu_cols])
log_otu <- log1p(otu_mat)
mic$lib_size <- rowSums(otu_mat)
```
```{r lib-size, fig.width=9, fig.height=4}
p_lib <- ggplot(mic, aes(lib_size, fill = Label)) +
  geom_histogram(bins = 30, alpha = 0.5, position = "identity") +
  scale_x_log10() +
  labs(title = "Library size after prevalence filter", x = "Total counts (log10 axis)", y = "Samples") +
  scale_fill_brewer(palette = "Set2")

p_raw <- mic |>
  slice_sample(n = min(500, nrow(mic))) |>
  dplyr::select(all_of(sample(otu_cols, min(80, length(otu_cols))))) |>
  pivot_longer(everything(), names_to = "otu", values_to = "count") |>
  ggplot(aes(count)) +
  geom_histogram(bins = 40, fill = "steelblue", color = "white") +
  scale_x_log10() +
  labs(
    title = "Raw count distribution (random OTU subset)",
    x = "Count (log10 axis)",
    y = "OTU × sample entries"
  )

p_lib + p_raw + plot_layout(ncol = 2)
```
```{r sparsity, fig.width=7, fig.height=4}
prev_by_otu <- colMeans(otu_mat > 0)
ggplot(tibble(prevalence = prev_by_otu), aes(prevalence)) +
  geom_histogram(bins = 30, fill = "darkorange", color = "white") +
  geom_vline(xintercept = 0.10, linetype = 2, linewidth = 0.8) +
  labs(
    title = "OTU prevalence after filtering",
    subtitle = "Dashed line = 10% threshold used at load time",
    x = "Fraction of samples with count > 0",
    y = "Number of OTUs"
  )
```
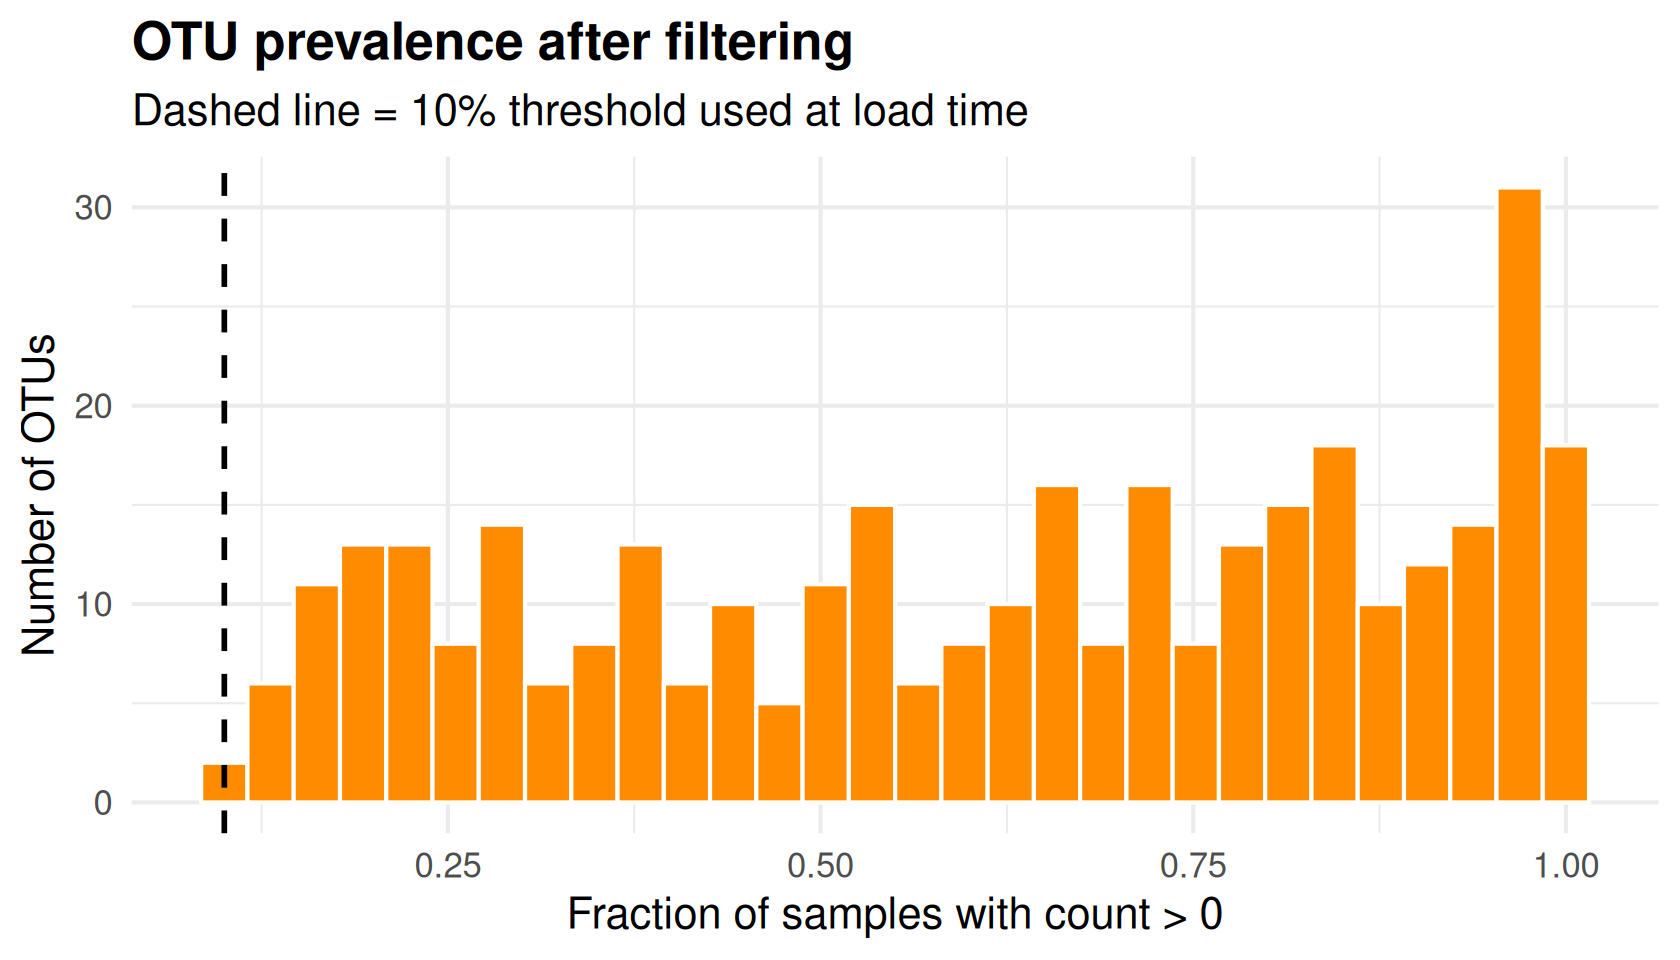
**Takeaway:** Even after filtering, most OTU × sample entries are still zero (sparse matrix). Distance-based methods and penalised regression behave very differently on this geometry than on the low-dimensional gene toy from the morning lecture.
# Part 2 — PCA exploration
## 1.3 PCA
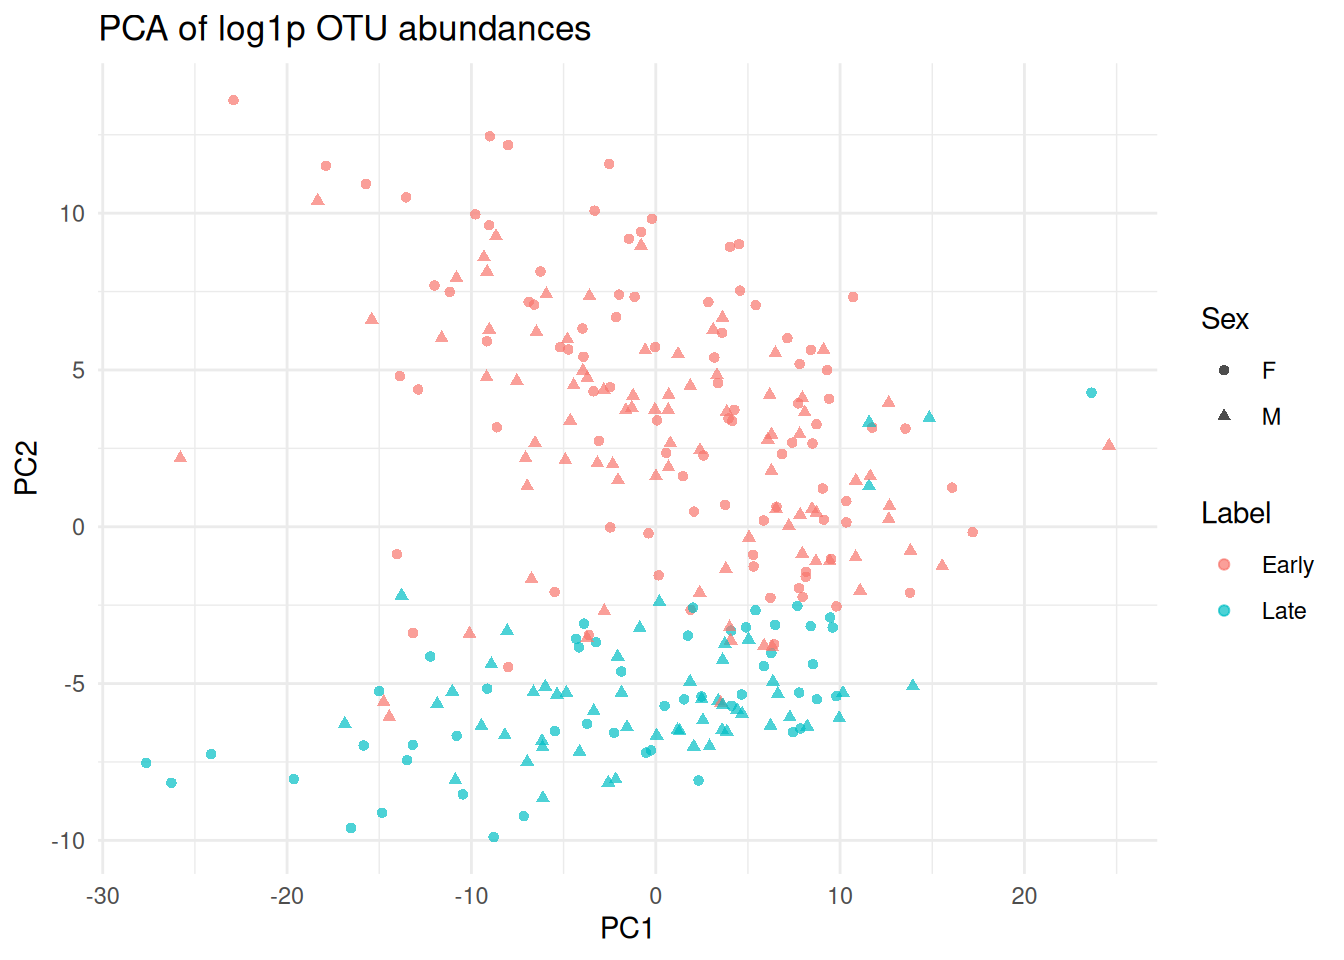
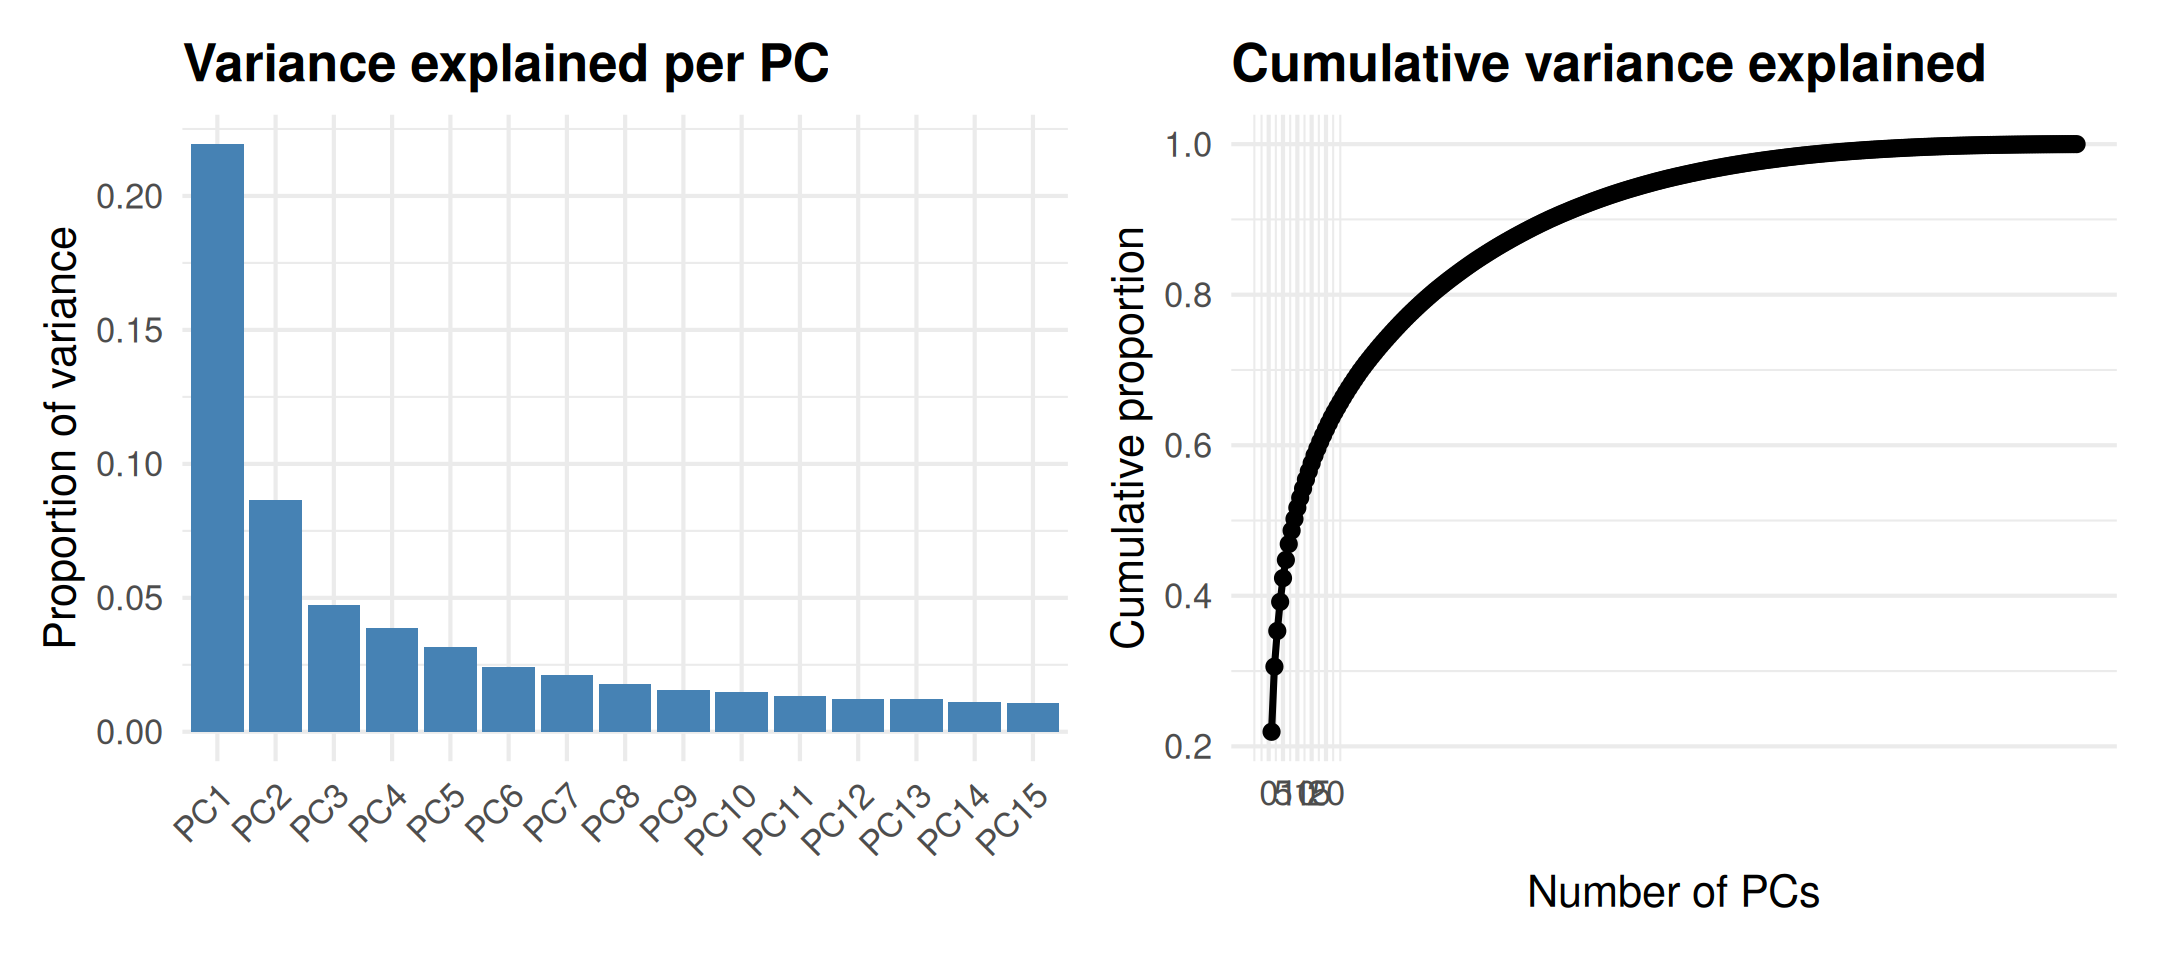
With **p ≫ n**, a logistic regression on every OTU is ill-conditioned. **PCA** rotates the log-transformed OTU table into orthogonal directions of decreasing variance. The first few **principal components (PCs)** summarise co-abundance patterns across many taxa.
```{r pca, fig.width=9, fig.height=5}
pc <- prcomp(log_otu, center = TRUE, scale. = TRUE)
var_expl <- pc$sdev^2 / sum(pc$sdev^2)
pc_df <- as_tibble(pc$x[, 1:2]) |>
  mutate(
    sample_id = mic$sample_id,
    Label = mic$Label,
    Sex = mic$Sex,
    Day = mic$Day
  )

p_scatter <- ggplot(pc_df, aes(PC1, PC2, color = Label, shape = Sex)) +
  geom_point(alpha = 0.75, size = 2.2) +
  scale_color_brewer(palette = "Set2") +
  labs(title = "PCA of log1p OTU abundances (PC1 vs PC2)")

p_scree <- tibble(
  PC = factor(paste0("PC", seq_along(var_expl)), levels = paste0("PC", seq_along(var_expl))),
  variance = var_expl
) |>
  slice_head(n = 15) |>
  ggplot(aes(PC, variance)) +
  geom_col(fill = "steelblue") +
  labs(
    title = "Variance explained per PC",
    x = NULL,
    y = "Proportion of variance"
  ) +
  theme(axis.text.x = element_text(angle = 45, hjust = 1))

p_cum <- tibble(
  PC = seq_along(var_expl),
  cumulative = cumsum(var_expl)
) |>
  ggplot(aes(PC, cumulative)) +
  geom_line(linewidth = 1) +
  geom_point() +
  scale_x_continuous(breaks = seq(0, 20, by = 5)) +
  labs(
    title = "Cumulative variance explained",
    x = "Number of PCs",
    y = "Cumulative proportion"
  )

p_scatter
```
```{r pca-extra, fig.width=9, fig.height=4}
(p_scree | p_cum) + plot_layout(ncol = 2)
cum5 <- sum(var_expl[1:5])
cat(sprintf("First 5 PCs explain %.1f%% of total variance.\n", 100 * cum5))
```
**Takeaway:** If PC1–PC2 separate `Early` and `Late`, a linear classifier in PC space has a fighting chance. If overlap is large, even a flexible method will struggle — especially with in-sample evaluation only.
# Part 3 — Label: Early vs Late
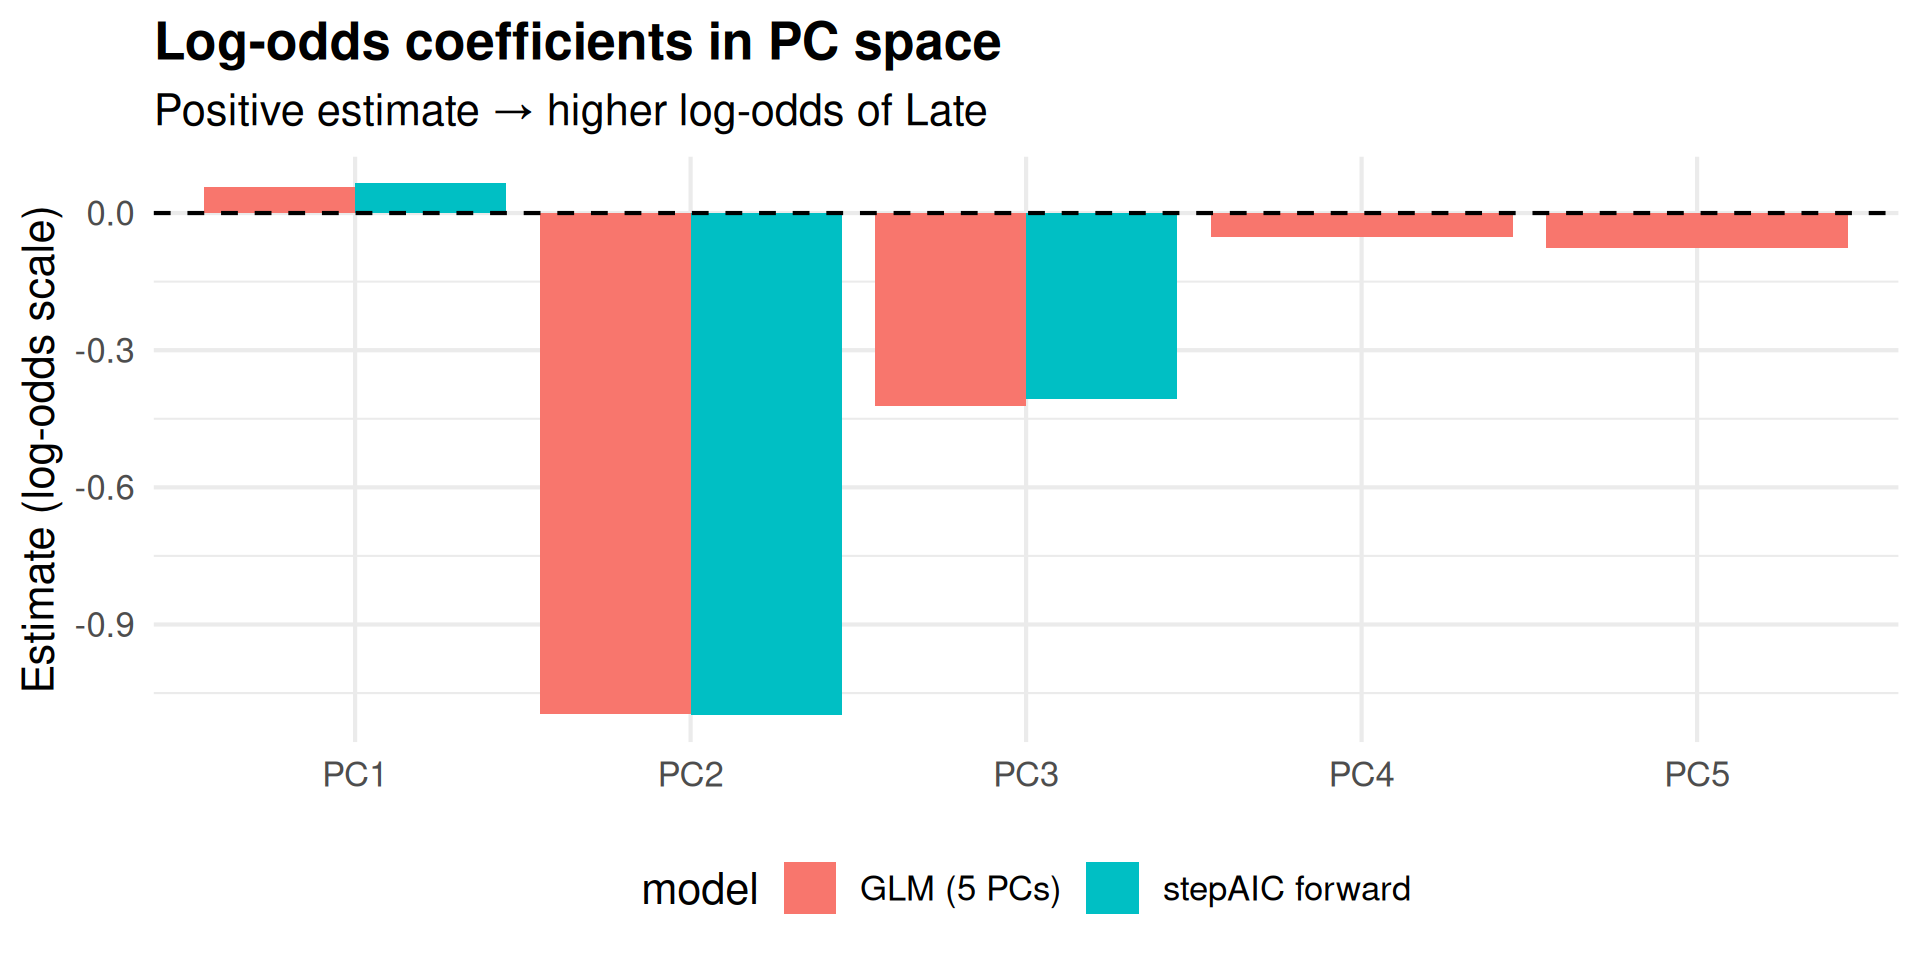
## 1.4–1.6 Three routes to the same question
We compare three strategies on **`Label`**:
| Approach | Predictors | Idea |
|----------|------------|------|
| **GLM on PCs** | 5 principal components | Compress correlated OTUs, then logistic regression |
| **stepAIC** | Subset of PCs | Let AIC choose how many PCs to keep |
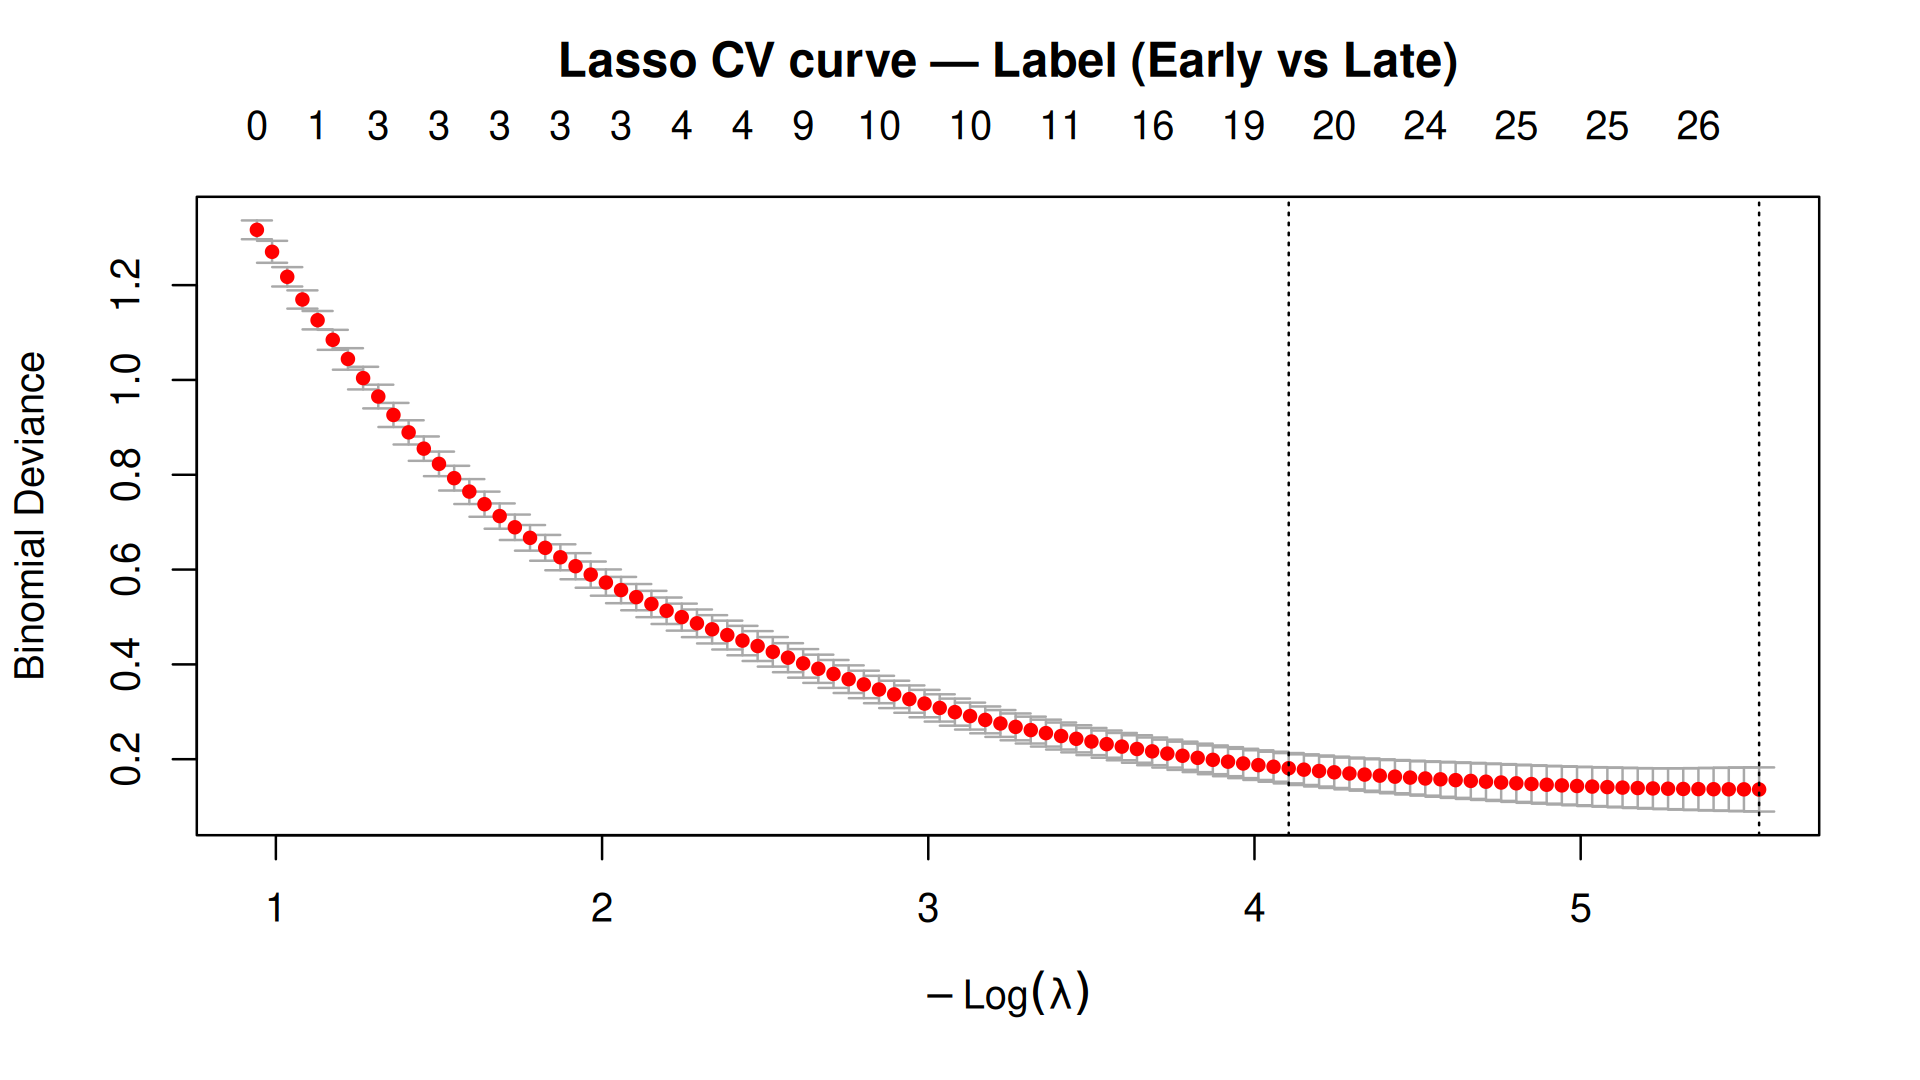
| **Lasso** | All OTUs (scaled) | Penalise coefficients; sparse OTU-level solution |
```{r label-pcs}
n_pc <- 5
pc_scores <- as.data.frame(pc$x[, seq_len(n_pc), drop = FALSE])
colnames(pc_scores) <- paste0("PC", seq_len(n_pc))
dat_label <- cbind(Label = mic$Label, pc_scores)

label_fits <- fit_label_models(dat_label, log_otu, mic$Label, n_pc = n_pc)
m_glm <- label_fits$glm
m_fwd <- label_fits$forward
m_bwd <- label_fits$backward
cv_fit <- label_fits$lasso

cat("Full GLM on 5 PCs:\n")
print(summary(m_glm)$coefficients)
cat("\nstepAIC formulas:\n")
print(list(forward = formula(m_fwd), backward = formula(m_bwd)))
```
```{r label-coef-plot, fig.width=8, fig.height=4}
coef_glm <- broom::tidy(m_glm) |>
  filter(term != "(Intercept)") |>
  mutate(model = "GLM (5 PCs)")

coef_fwd <- broom::tidy(m_fwd) |>
  filter(term != "(Intercept)") |>
  mutate(model = "stepAIC forward")

bind_rows(coef_glm, coef_fwd) |>
  ggplot(aes(term, estimate, fill = model)) +
  geom_col(position = "dodge") +
  geom_hline(yintercept = 0, linetype = 2) +
  labs(
    title = "Log-odds coefficients in PC space",
    subtitle = "Positive estimate → higher log-odds of Late",
    x = NULL,
    y = "Estimate (log-odds scale)"
  ) +
  theme(axis.text.x = element_text(angle = 0))
```
```{r label-lasso}
lasso_coef <- as.matrix(coef(cv_fit, s = "lambda.min"))
nonzero <- lasso_coef[lasso_coef[, 1] != 0, , drop = FALSE]
cat("Non-zero lasso coefficients at lambda.min:\n")
print(round(nonzero, 4))
n_coef_lasso <- nrow(nonzero) - 1
```
```{r label-lasso-path, fig.width=8, fig.height=4.5}
plot(cv_fit)
title("Lasso CV curve — Label (Early vs Late)", line = 2.5)
```
```{r label-lasso-top, fig.width=9, fig.height=5}
lasso_tbl <- tibble(
  otu = rownames(lasso_coef),
  estimate = as.numeric(lasso_coef)
) |>
  filter(otu != "(Intercept)", estimate != 0) |>
  mutate(abs_est = abs(estimate)) |>
  slice_max(abs_est, n = 15) |>
  annotate_otu(tax)

ggplot(lasso_tbl, aes(reorder(display, abs_est), estimate, fill = estimate > 0)) +
  geom_col(show.legend = FALSE) +
  coord_flip() +
  scale_fill_manual(values = c("TRUE" = "firebrick", "FALSE" = "steelblue")) +
  labs(
    title = "Top lasso OTU coefficients (lambda.min)",
    subtitle = "Labels from taxonomy.csv where available; red = higher abundance pushes toward Late",
    x = NULL,
    y = "Coefficient on scaled log1p OTUs"
  )
```
```{r label-metrics}
met_glm <- in_sample_metrics(mic$Label, predict(m_glm, type = "response"), positive = "Late")
met_fwd <- in_sample_metrics(mic$Label, predict(m_fwd, dat_label, type = "response"), positive = "Late")
met_bwd <- in_sample_metrics(mic$Label, predict(m_bwd, dat_label, type = "response"), positive = "Late")
pred_lasso <- predict(cv_fit, newx = label_fits$x_lasso, s = "lambda.min", type = "response")
met_lasso <- in_sample_metrics(mic$Label, as.numeric(pred_lasso), positive = "Late")

label_summary <- bind_rows(
  model_row("Label", "GLM (5 PCs)", n_pc, met_glm, AIC(m_glm)),
  model_row("Label", "stepAIC forward", length(coef(m_fwd)) - 1, met_fwd, AIC(m_fwd)),
  model_row("Label", "stepAIC backward", length(coef(m_bwd)) - 1, met_bwd, AIC(m_bwd)),
  model_row("Label", "Lasso (all OTUs)", n_coef_lasso, met_lasso, aic = NA_real_)
)

knitr::kable(label_summary, digits = 3, caption = "In-sample performance — Label")
```
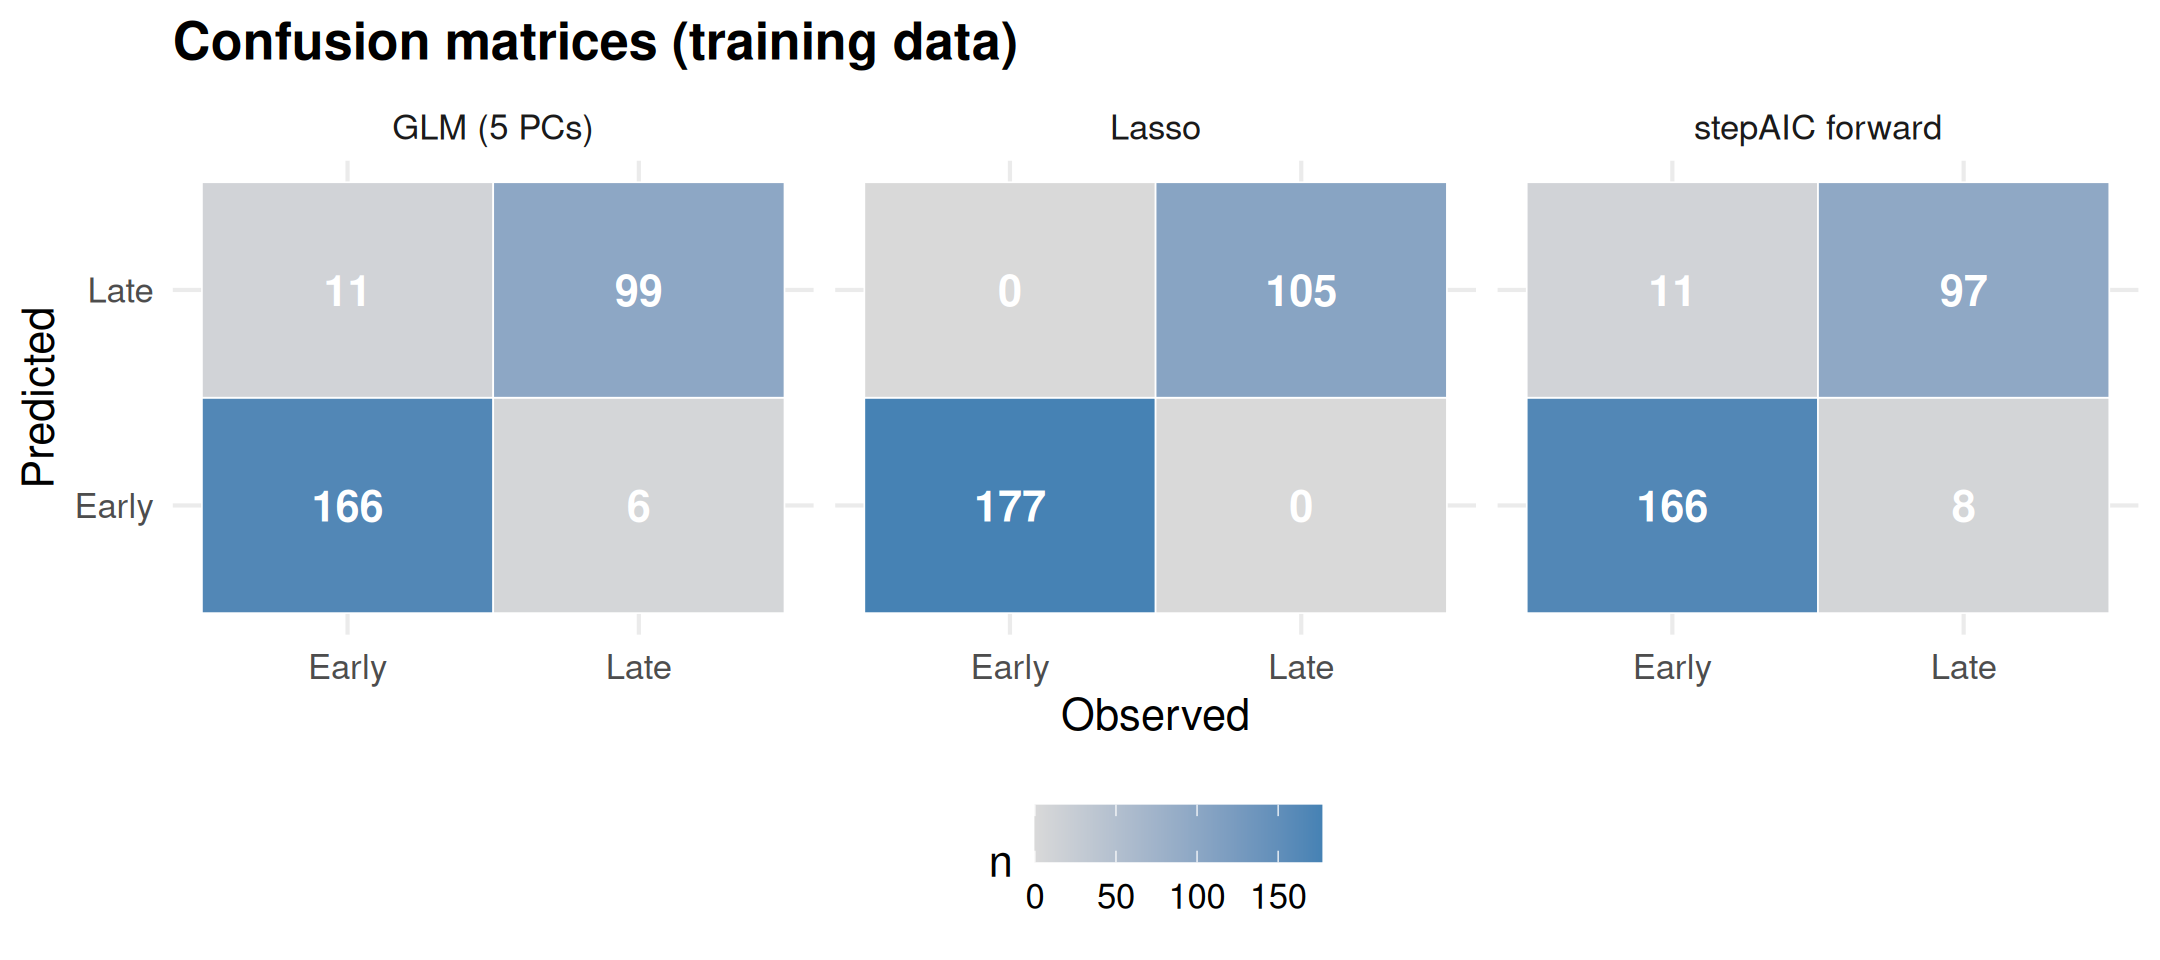
```{r label-confusion, fig.width=9, fig.height=4}
conf_to_df <- function(tab, model) {
  as.data.frame.matrix(tab) |>
    rownames_to_column("Predicted") |>
    pivot_longer(-Predicted, names_to = "Observed", values_to = "n") |>
    mutate(model = model)
}

bind_rows(
  conf_to_df(met_glm$confusion, "GLM (5 PCs)"),
  conf_to_df(met_fwd$confusion, "stepAIC forward"),
  conf_to_df(met_lasso$confusion, "Lasso")
) |>
  ggplot(aes(Observed, Predicted, fill = n)) +
  geom_tile(color = "white") +
  geom_text(aes(label = n), color = "white", fontface = "bold") +
  facet_wrap(~ model) +
  scale_fill_gradient(low = "grey85", high = "steelblue") +
  labs(title = "Confusion matrices (training data)", x = "Observed", y = "Predicted")
```
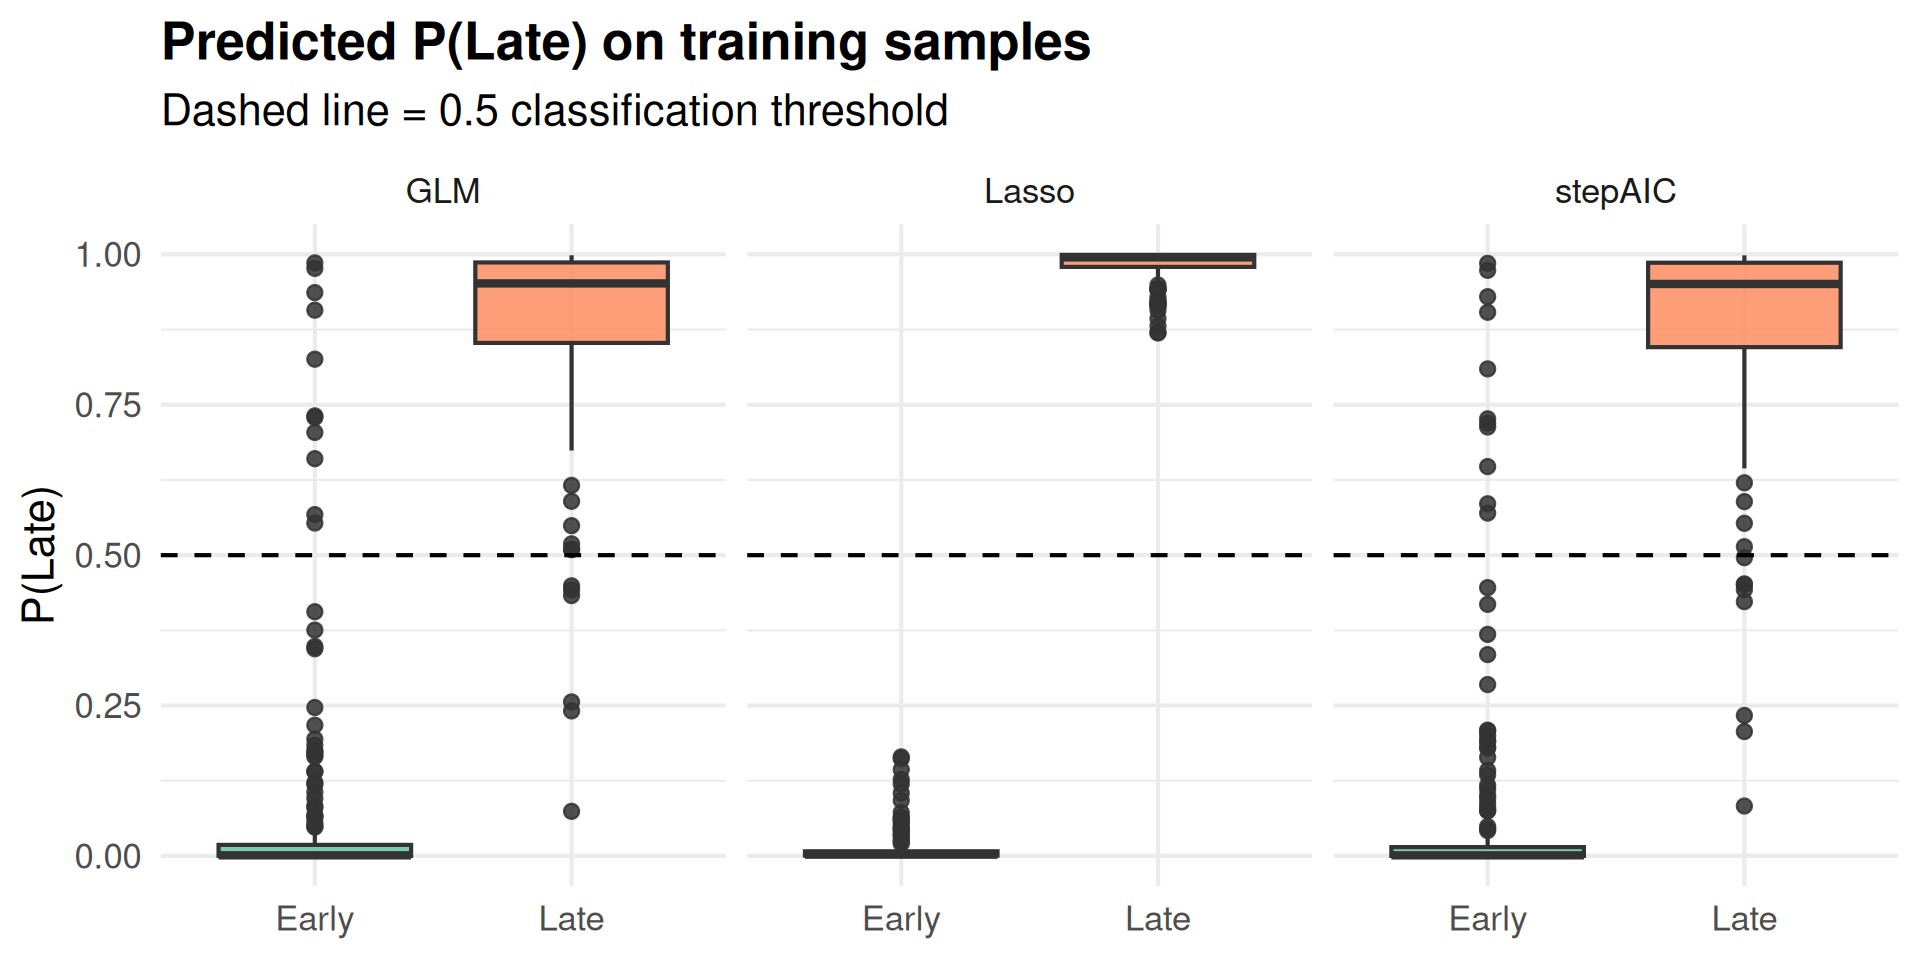
```{r label-prob-box, fig.width=8, fig.height=4}
prob_df <- tibble(
  Label = mic$Label,
  GLM = predict(m_glm, type = "response"),
  stepAIC = predict(m_fwd, dat_label, type = "response"),
  Lasso = as.numeric(pred_lasso)
) |>
  pivot_longer(c(GLM, stepAIC, Lasso), names_to = "model", values_to = "prob_late")

ggplot(prob_df, aes(Label, prob_late, fill = Label)) +
  geom_boxplot(alpha = 0.85, show.legend = FALSE) +
  facet_wrap(~ model) +
  geom_hline(yintercept = 0.5, linetype = 2) +
  scale_fill_brewer(palette = "Set2") +
  labs(
    title = "Predicted P(Late) on training samples",
    subtitle = "Dashed line = 0.5 classification threshold",
    x = NULL,
    y = "P(Late)"
  )
```
### Label — comparison
```{r label-discussion, echo=FALSE, results='asis'}
cat(
"- **Dimensionality:** GLM and stepAIC operate on ", n_pc, " constructed PCs; lasso uses ",
ncol(log_otu), " OTU predictors but returns only ", n_coef_lasso, " non-zero coefficients at `lambda.min`.\n",
"- **Interpretability:** PC coefficients are rotations of the full OTU table — hard to name a single bacterium. Lasso coefficients map to OTU IDs; join `taxonomy.csv` for genus/family names (see section above).\n",
"- **AIC vs lasso:** stepAIC chose `", deparse(formula(m_fwd)), "` with AIC = ", round(AIC(m_fwd), 1),
". Lasso uses cross-validated lambda instead of AIC; the two criteria need not agree.\n",
"- **Accuracy:** All metrics here are **in-sample** (fit and score on the same rows). Differences between methods can look small; hold-out or grouped CV (Tuesday/Day 4) is the honest check.\n",
sep = ""
)
```
# Part 4 — Sex: Female vs Male
## 1.7 Repeat for Sex
Sex prediction is often **harder** than Early/Late in this cohort: microbiome differences between males and females can be subtle relative to temporal drift. We repeat the same workflow on rows with known `Sex`, dropping zero-variance OTUs in this subset.
```{r sex-filter}
mic_sex <- mic |> filter(Sex %in% c("F", "M"))
otu_sex <- log1p(as.matrix(mic_sex[, otu_cols]))
zv_sex <- apply(otu_sex, 2, sd) > 1e-10
otu_sex <- otu_sex[, zv_sex, drop = FALSE]

pc_sex <- prcomp(otu_sex, center = TRUE, scale. = TRUE)
pc_s <- as.data.frame(pc_sex$x[, seq_len(n_pc), drop = FALSE])
colnames(pc_s) <- paste0("PC", seq_len(n_pc))
dat_sex <- cbind(Sex = factor(mic_sex$Sex, levels = c("F", "M")), pc_s)

sex_fits <- fit_label_models(
  dat_sex |> rename(Label = Sex),
  otu_sex,
  mic_sex$Sex,
  n_pc = n_pc
)
m_sex <- sex_fits$glm
m_sex_fwd <- sex_fits$forward
cv_sex <- sex_fits$lasso
```
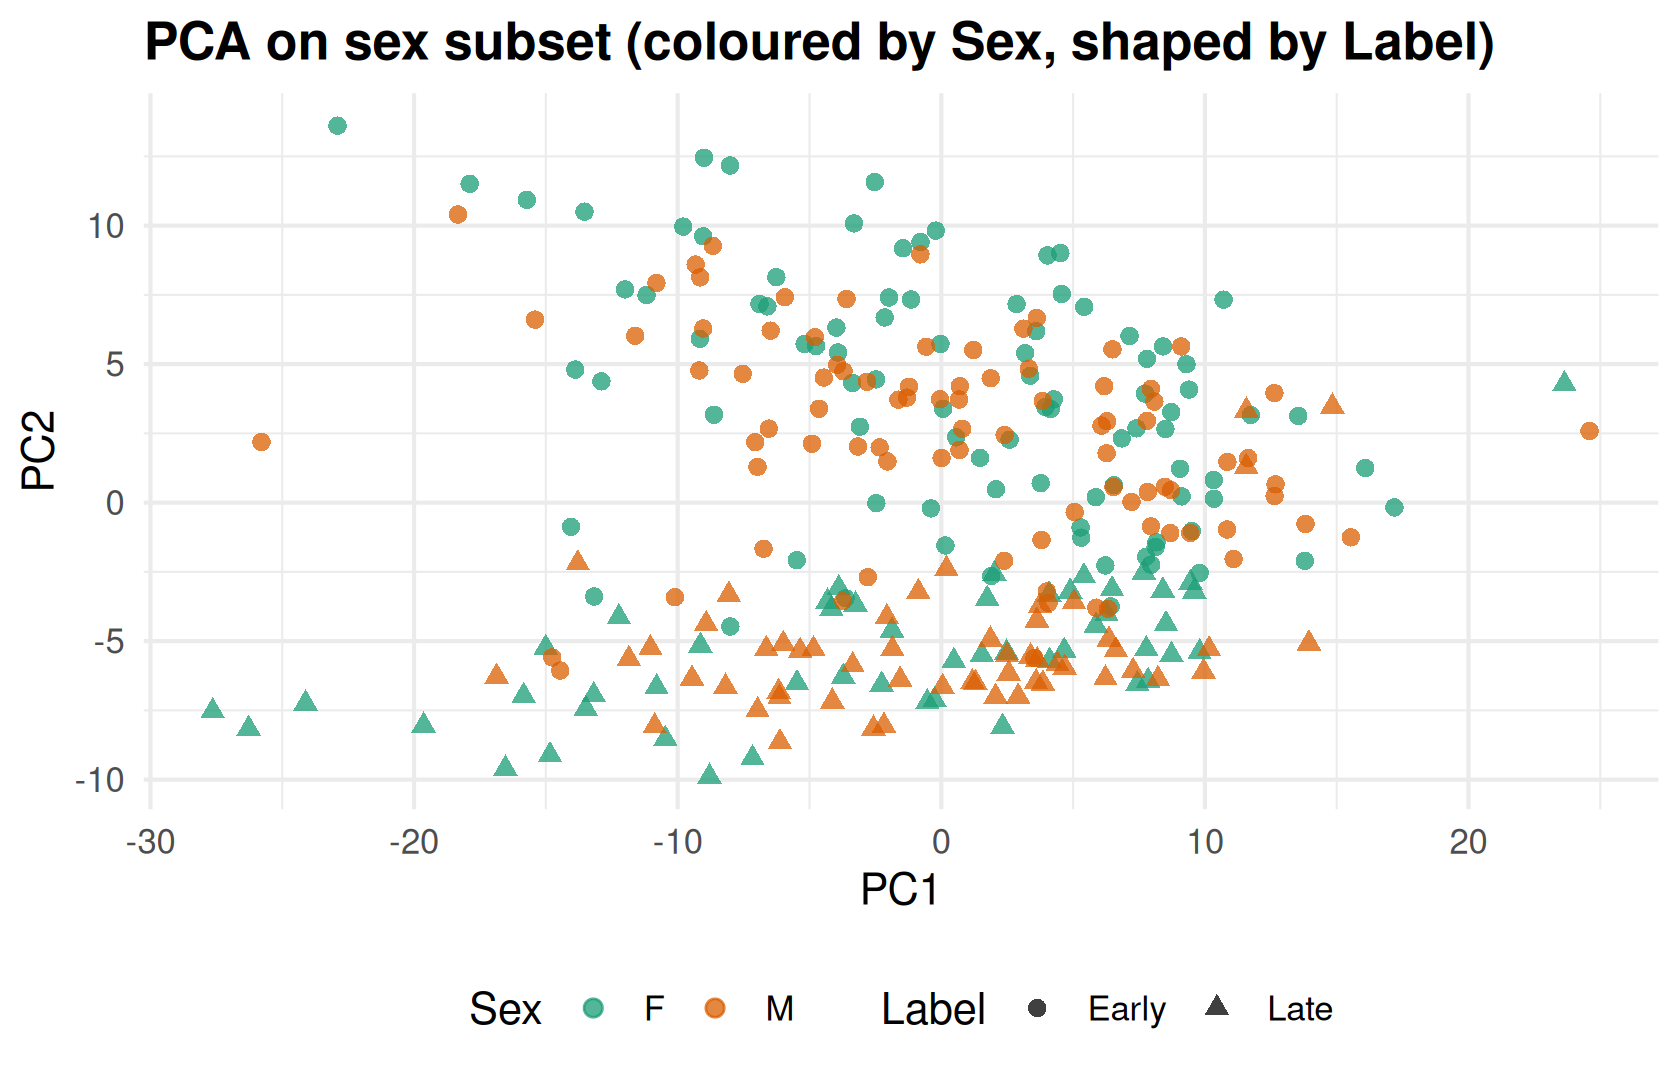
```{r sex-pca, fig.width=7, fig.height=4.5}
pc_sex_df <- as_tibble(pc_sex$x[, 1:2]) |>
  mutate(Sex = mic_sex$Sex, Label = mic_sex$Label)

ggplot(pc_sex_df, aes(PC1, PC2, color = Sex, shape = Label)) +
  geom_point(alpha = 0.75, size = 2.2) +
  scale_color_brewer(palette = "Dark2") +
  labs(title = "PCA on sex subset (coloured by Sex, shaped by Label)")
```
```{r sex-metrics}
met_sex_glm <- in_sample_metrics(mic_sex$Sex, predict(m_sex, type = "response"), positive = "M")
met_sex_fwd <- in_sample_metrics(mic_sex$Sex, predict(m_sex_fwd, dat_sex, type = "response"), positive = "M")
pred_sex_lasso <- predict(cv_sex, newx = sex_fits$x_lasso, s = "lambda.min", type = "response")
met_sex_lasso <- in_sample_metrics(mic_sex$Sex, as.numeric(pred_sex_lasso), positive = "M")
n_coef_sex_lasso <- sum(coef(cv_sex, s = "lambda.min") != 0) - 1

sex_summary <- bind_rows(
  model_row("Sex", "GLM (5 PCs)", n_pc, met_sex_glm, AIC(m_sex)),
  model_row("Sex", "stepAIC forward", length(coef(m_sex_fwd)) - 1, met_sex_fwd, AIC(m_sex_fwd)),
  model_row("Sex", "Lasso (all OTUs)", n_coef_sex_lasso, met_sex_lasso, aic = NA_real_)
)

knitr::kable(sex_summary, digits = 3, caption = "In-sample performance — Sex")
```
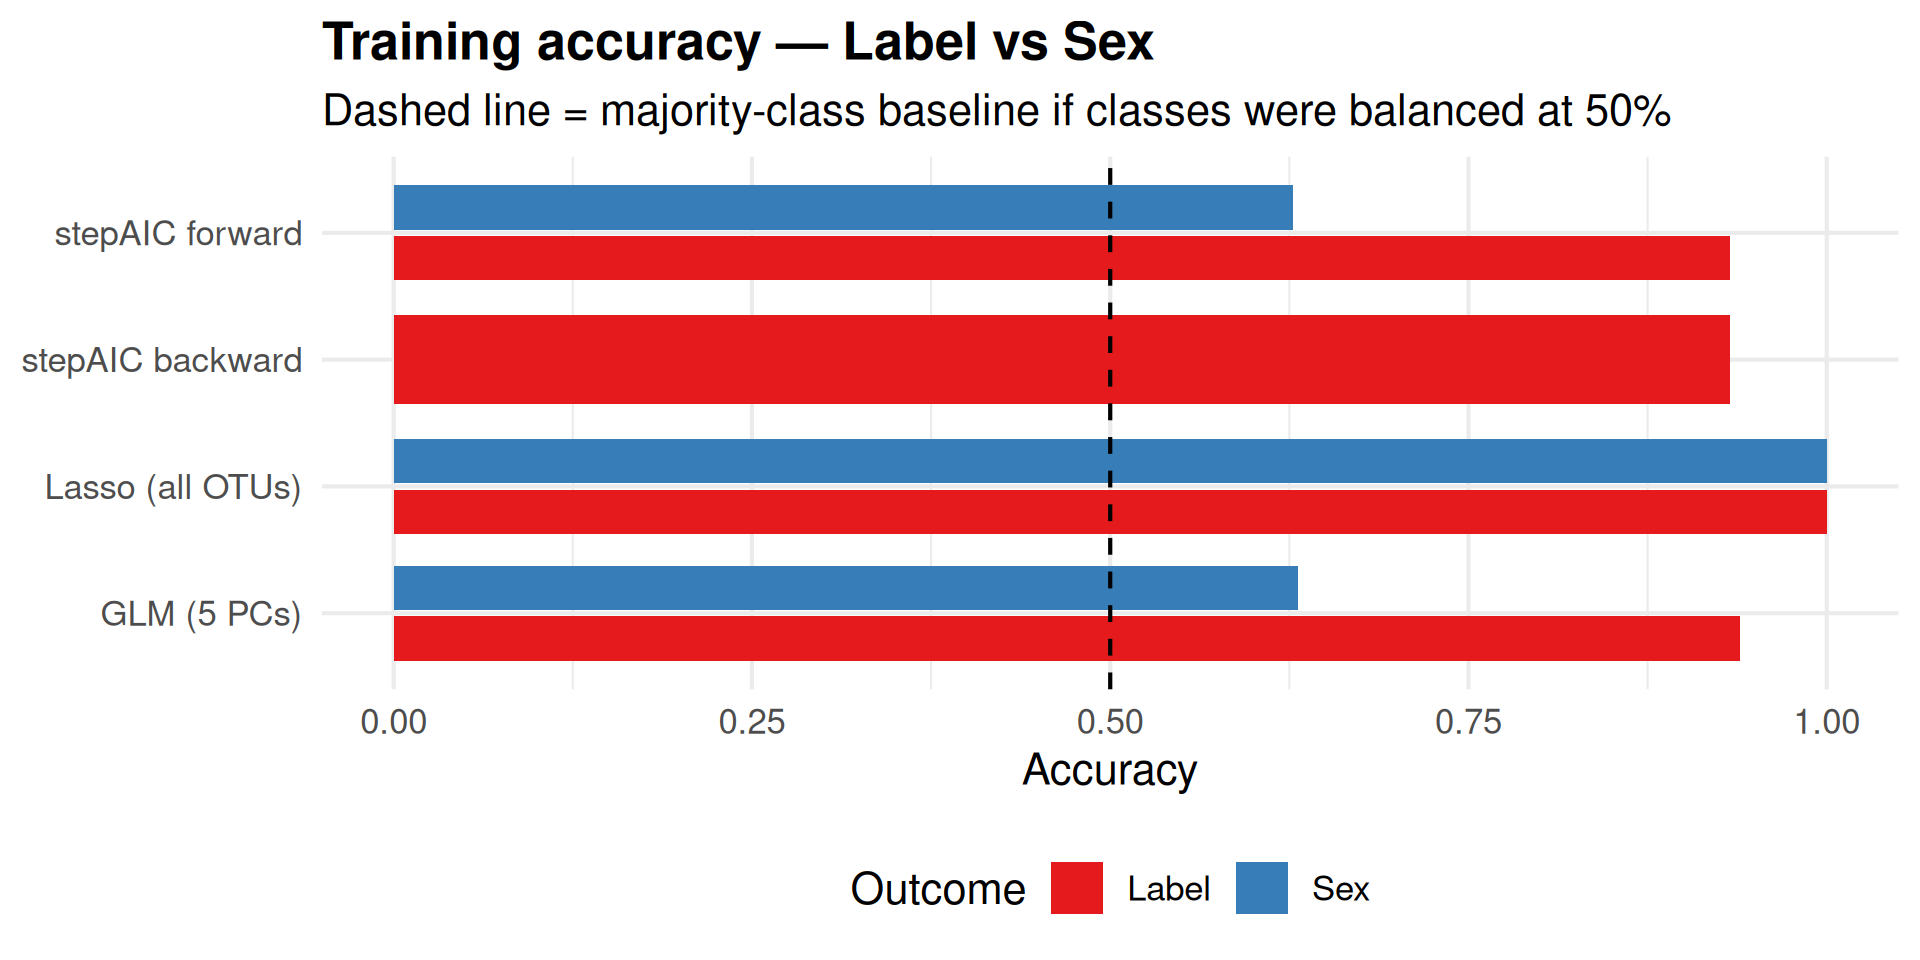
```{r sex-compare-plot, fig.width=8, fig.height=4}
bind_rows(label_summary, sex_summary) |>
  mutate(outcome = factor(outcome, levels = c("Label", "Sex"))) |>
  ggplot(aes(method, train_accuracy, fill = outcome)) +
  geom_col(position = position_dodge(width = 0.8), width = 0.7) +
  geom_hline(yintercept = 0.5, linetype = 2) +
  coord_flip() +
  scale_fill_brewer(palette = "Set1") +
  labs(
    title = "Training accuracy — Label vs Sex",
    subtitle = "Dashed line = majority-class baseline if classes were balanced at 50%",
    x = NULL,
    y = "Accuracy",
    fill = "Outcome"
  )
```
# Part 5 — Summary and synthesis
## 1.8 Summary table
```{r summary}
summary_tbl <- bind_rows(label_summary, sex_summary) |>
  dplyr::select(outcome, method, n_predictors, train_accuracy, sensitivity, specificity, AIC)

knitr::kable(summary_tbl, digits = 3, caption = "Full comparison across outcomes and methods")
```
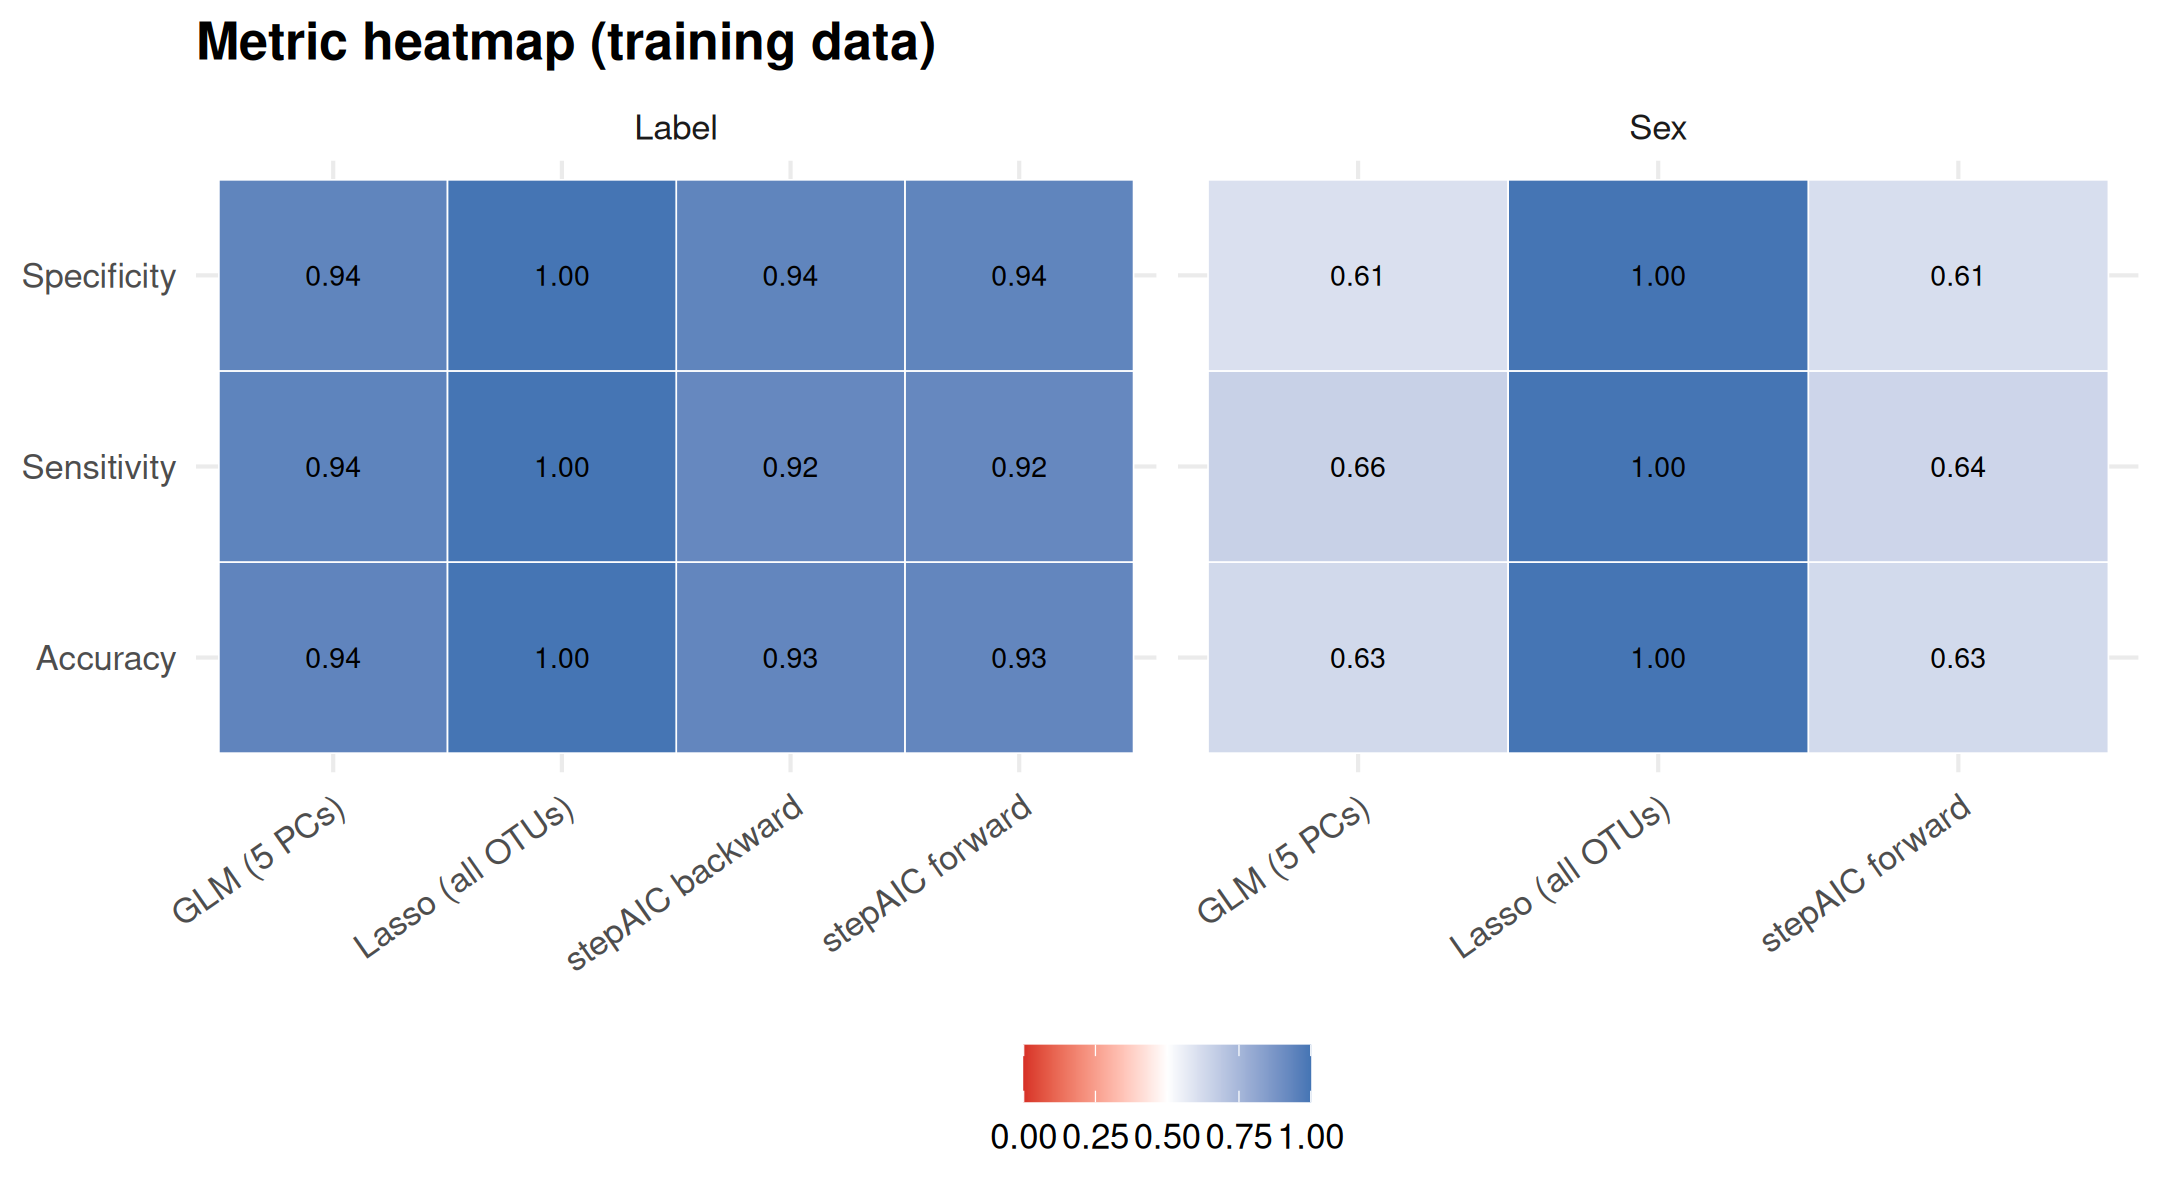
```{r summary-heatmap, fig.width=9, fig.height=5}
summary_tbl |>
  dplyr::select(outcome, method, train_accuracy, sensitivity, specificity) |>
  pivot_longer(c(train_accuracy, sensitivity, specificity), names_to = "metric", values_to = "value") |>
  mutate(
    metric = recode(metric,
      train_accuracy = "Accuracy",
      sensitivity = "Sensitivity",
      specificity = "Specificity"
    )
  ) |>
  ggplot(aes(method, metric, fill = value)) +
  geom_tile(color = "white") +
  geom_text(aes(label = sprintf("%.2f", value)), size = 3) +
  facet_wrap(~ outcome, scales = "free_x") +
  scale_fill_gradient2(low = "#d73027", mid = "white", high = "#4575b4", midpoint = 0.5, limits = c(0, 1)) +
  theme(axis.text.x = element_text(angle = 35, hjust = 1)) +
  labs(title = "Metric heatmap (training data)", x = NULL, y = NULL, fill = NULL)
```
## Synthesis — what did we learn?
1. **Two high-dimensional strategies:** PCA + GLM builds a small set of uncorrelated predictors; lasso keeps OTU names but needs penalisation. They answer different scientific questions (community axes vs sparse taxa list).
2. **Model selection:** stepAIC on PCs trades parsimony for AIC; lasso's `lambda.min` trades bias-variance via cross-validation. Neither replaces an external test set.
3. **Outcome difficulty:** Compare the Label and Sex panels — if Sex accuracy hovers near 0.5, the models are barely beating chance despite similar machinery.
4. **Next steps (Tuesday):** Wrap log1p + normalize in a `recipe`, use `workflow()`, and hold out a test set. **Day 4:** use `group_vfold_cv(group = Individual)` so the same mouse does not appear in both train and validation.
```{r session, echo=FALSE}
sessionInfo()
```