Data card — Old Faithful eruptions
How to load
faithful_df <- tibble::as_tibble(datasets::faithful)
# or: data("faithful")  # same table in base R
Where we use this
- Day 1 (Monday) slides — first ggplot demo (scatter, smooth, facets)
- Photo:
assets/figures/shared/old_faithful.jpg
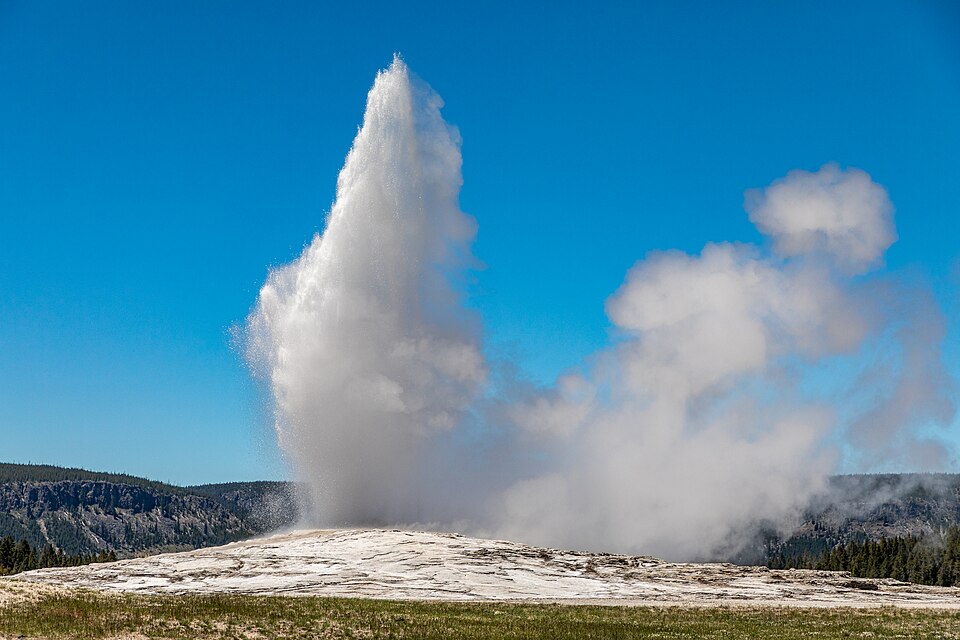
Caveats
- Observational Yellowstone geyser records; not designed for prediction benchmarks.
- Bivariate only — used to teach plotting and tidy data habits, not full modeling pipelines.
Data card
1. Source
Built-in R table faithful (also in datasets). Classic measurements of the Old Faithful geyser (Yellowstone): eruption duration and waiting time between eruptions. No separate download; no package beyond base R / datasets.
2. Outcome
No fixed outcome in our course — we treat both columns as exploratory. If you modeled: either waiting or eruptions (minutes) as a numeric target.
3. Predictors
Two numeric columns:
| Column | Meaning |
|---|---|
eruptions |
Eruption duration (minutes) |
waiting |
Waiting time to next eruption (minutes) |
4. Sample size
272 rows. No missing values in the built-in table.
5. Leakage risks
Low for our use (plots only). If modeling: fitting and evaluating on the same 272 rows without a holdout would overstate performance; not a concern for the Day 1 visualization block.
6. Subgroups
Not used in class. In a research setting you might record season or measurement era; this table has no such fields.